

Transform data
Create an SQL transformation that joins a summer of sales, rosters and weather with a live forecast into one table per café and day, and learn how mappings keep Storage safe.
The sales table knows how many cups each café sold on each day of the summer. The weather table
knows what kind of day it was. The roster knows how many people were on shift, and the forecast
knows what next week looks like. None of them knows what the others know. This step joins all
five with SQL into one table, staffing_outlook: 42 rows, one per café per forecast day, each
saying how busy that day should be, who is rostered, and whether that is enough. It also
introduces the mapping model that keeps your source data safe while you do it.
Where you are: six raw tables are in Storage and nothing has been joined yet. When you finish: one table that answers the question, and a transformation you can re-run.
Before you start
You need
- A Keboola project. No project yet? Get a project.
The five tables it reads, in Storage from Get your data in:
stores,sales,staffingandweather_dailyin one bucket,forecastin another.
Depending on the tab you use
- Prompt tab: Kai, the Kai Agent button in the project's top bar, on supported stacks. The first time, an organization admin switches it on; see Get started with Kai.
- UI tab: only a browser.
- CLI / API tab: kbagent, connected to your project with write access.
Three ways to do this, one page. They are alternatives, not steps. Prompt is what you paste into Kai; UI is the same task click by click, for when you want to see where each setting lives; CLI / API is the same task from a terminal, with the raw request beside it. Pick one tab and carry on; your choice follows you to the next page.
Kai asks before it changes anything: expect one approval dialog per object it creates, showing the exact configuration it is about to write. Questions that only read do not ask. If confirming each one gets tiring, pre-approve tools in tool permissions. The chat's plan mode button is a different thing: Kai writes the steps down and asks you to approve the plan before it starts, and then still asks for each change. Use it when you want to read the plan first, not to save clicks.
If a step builds something other than what this page describes, say so in the same chat; it edits what it made. Nothing here is one-way.
The bucket names do not matter, and they contain configuration IDs, so yours will not match the
screenshots. What the SQL depends on is the Table name you give each table
in the input mapping below: those must be exactly sales, weather_daily, staffing, stores and
forecast, or you have to edit the queries to match. (products is not needed for this table.)
How a transformation works
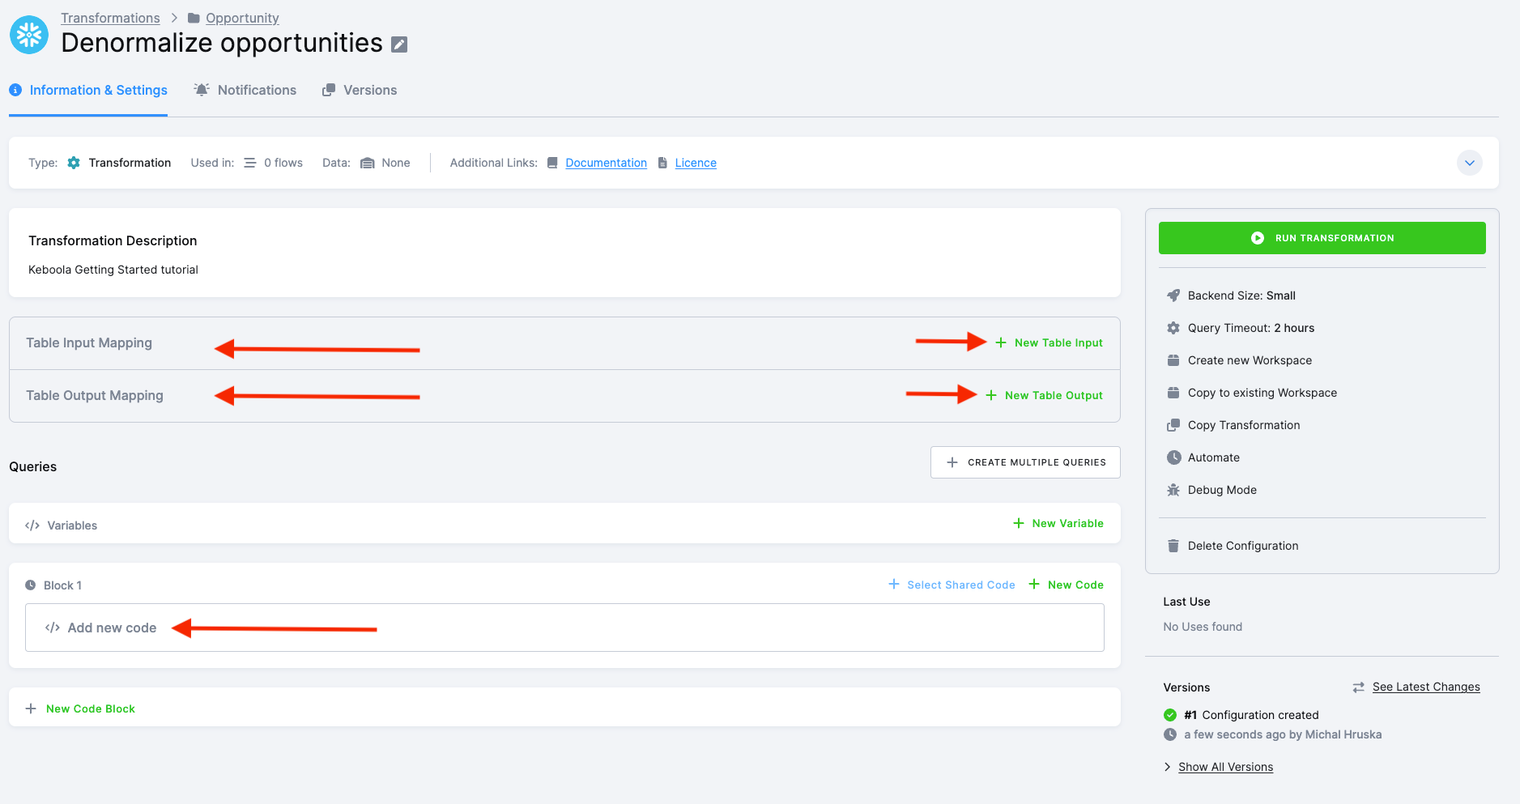
Section titled “How a transformation works”A transformation never runs against your Storage tables directly. Keboola copies the tables you ask for into a temporary database schema, runs your queries there, and copies back only the results you ask for. Three settings control that:
- Input mapping decides which Storage tables get copied in, and what they are called inside the transformation. Anything you do not list is not visible to your code.
- Output mapping decides which tables your code produces get written back to Storage, and where. Anything you do not list is thrown away when the job ends.
- Queries are the SQL itself, organized into named code blocks.
That is the safeguard: the only tables your transformation can change are the ones named in the output mapping. It is also what lets Keboola track data lineage across the project.
What the SQL has to do
Section titled “What the SQL has to do”Four ideas, and the queries below are those four in order:
- Daily demand. Sum
unitsper café per day, and put that day’s temperature and rain next to it. - Weather bands. Sort every summer day into a temperature band (under 18 °C, 18 to under 23, 23 to under 28, 28 and over) and a rain band (dry under 0.5 mm, wet otherwise), then average the daily demand per café per band. That average is what a day like that has produced before.
- Roster. From
staffing, one headcount per café per weekday. The chain rosters by weekday, so this is a single value for every combination. - The outlook. Put each forecast day into its bands, look up the café’s average for that band and the roster for that weekday, divide one by the other, and flag anything over 67 cups per person.
The bands are half-open: < 18, then < 23, then < 28, then everything else, and a day at
exactly 23.0 °C belongs to exactly one of them. The same CASE appears twice in the query, once
for the summer and once for the forecast, and the two have to agree to the character: a forecast
day sorted into a band the history side never produced finds no average and comes out empty.
Nine summer days sit exactly on 18, 23 or 28 °C and twelve exactly on 0.5 mm, so where the
boundary falls is not academic.
Before either tab: find out which SQL your project speaks. Open Transformations and click Create Transformation; the New Transformation dialog lists what this project can run, and the SQL entry is either Snowflake SQL Transformation or Google BigQuery Transformation. New Free Plan projects default to the BigQuery backend; contract customers choose theirs. Close the dialog and carry that word into whichever tab you use.
Set it up
Section titled “Set it up”Writing SQL transformations is Kai’s home ground (SQL Transformations), and it already has your table schemas in front of it. Open Kai Agent in the top bar and ask:
Build a Snowflake transformation called "Boolabean staffing outlook" with one output table,staffing_outlook. Storage columns arrive as text, so cast before you compare or average.
1. Daily demand: from sales, sum units per store per date, and join weather_daily on store_id   and date.2. Weather bands: temperature under 18, 18 to under 23, 23 to under 28, and 28 and over, each   split into dry (rain under 0.5 mm) and wet (0.5 mm or more). Use half-open ranges so no day   lands in two bands. Average the daily units per store per band.3. Roster: from staffing, the rostered headcount per store per weekday. It is the same every   week, so this is one value per store and weekday.4. Forecast: the forecast table's location_id 0 to 5 maps to store_id S01 to S06 in that order,   the order the coordinates appear in the request URL.5. Output one row per store per forecast day with exactly these columns: store_name, city,   date, weekday, forecast_temp_c, forecast_rain_mm, expected_units (the store's historical   average in the matching band), rostered_staff, expected_units_per_person, and short_handed,   true when that figure exceeds 67.
Run it, then tell me how many rows staffing_outlook has and which store and day come out moststretched.
On a BigQuery project, say “BigQuery transformation” in the first line; everything else stands. The column list in point 5 is what the later pages type into their prompts and checks, so keep it as written.
Spelling out the five parts is the point. Ask only for “a staffing table” and you get a different set of columns, and the check below will not match. The half-open sentence matters most, and the cast sentence second: Kai samples the tables first to see the date format and the text values, and then casts everything it compares.
Kai builds the transformation on read-only input: it reads the source tables by their full Storage names and leaves the input mapping empty, so you will not see one in its configuration. The mapping sections of the UI tab describe the hand-built path; the result is the same table. Expect two approvals, one for the transformation and one for the run.
Check: Kai reports staffing_outlook with 42 rows and names the most stretched café and
day. If the count differs, the joins differ: re-prompt, or fix the code in place. Later steps
depend only on the table name, so a close-enough table is fine.
Create the transformation
-
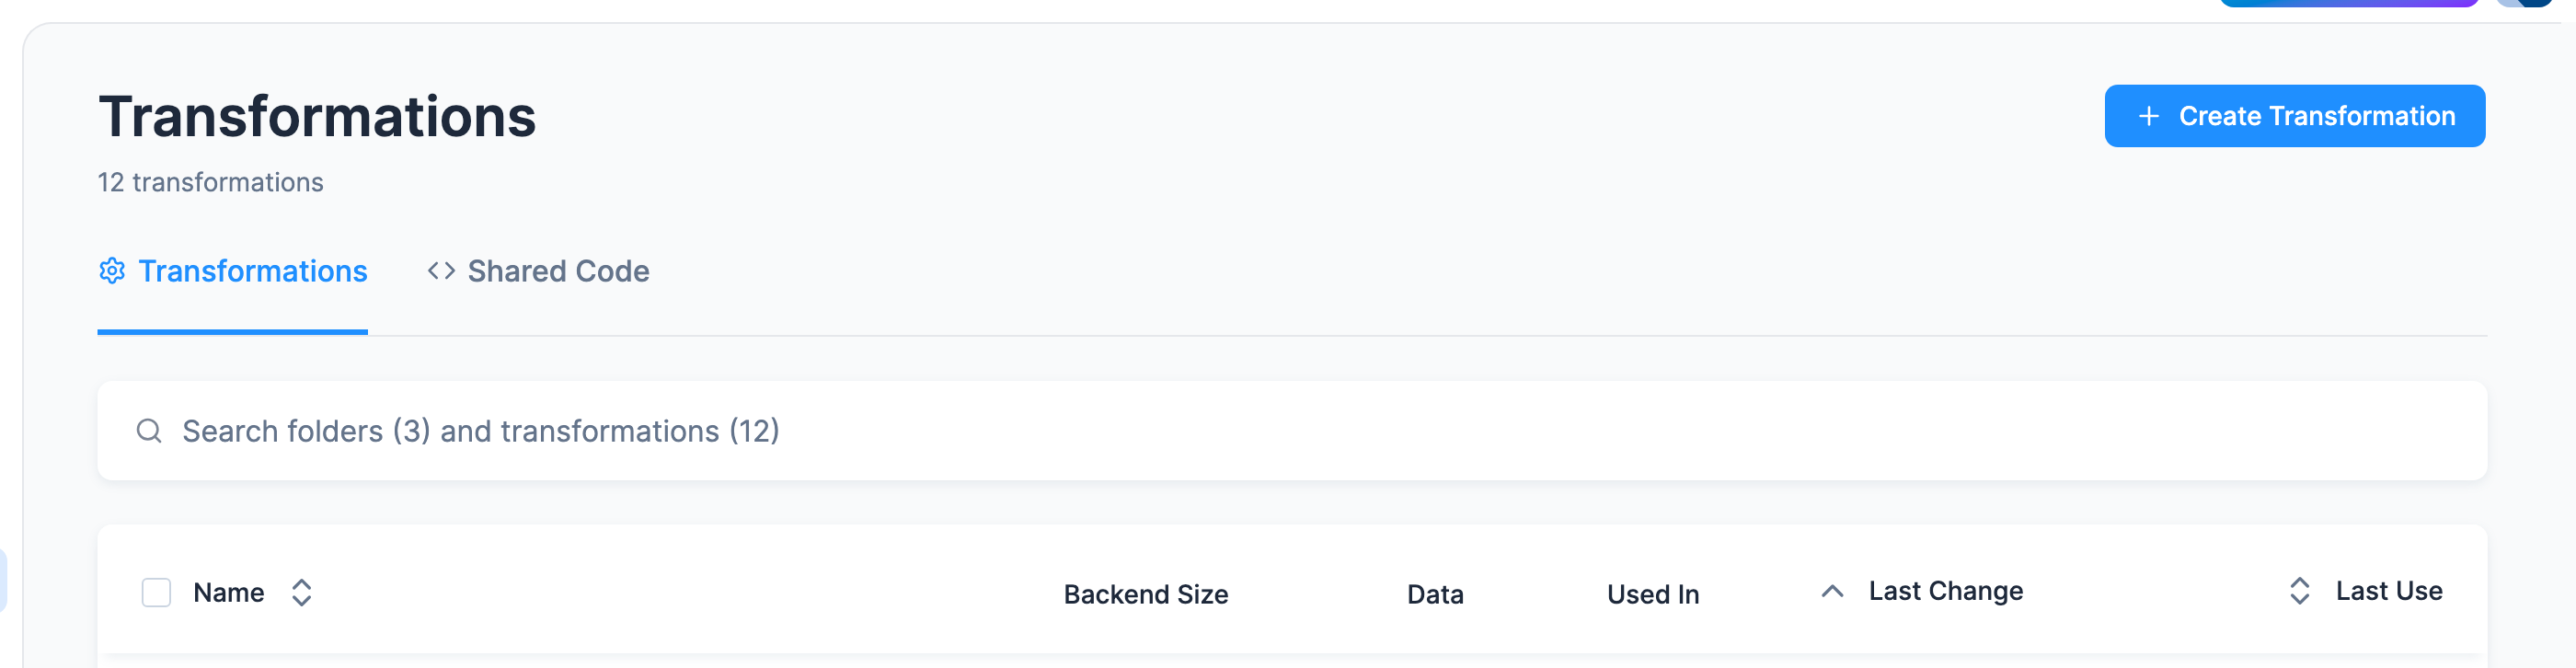
Open Transformations.
-
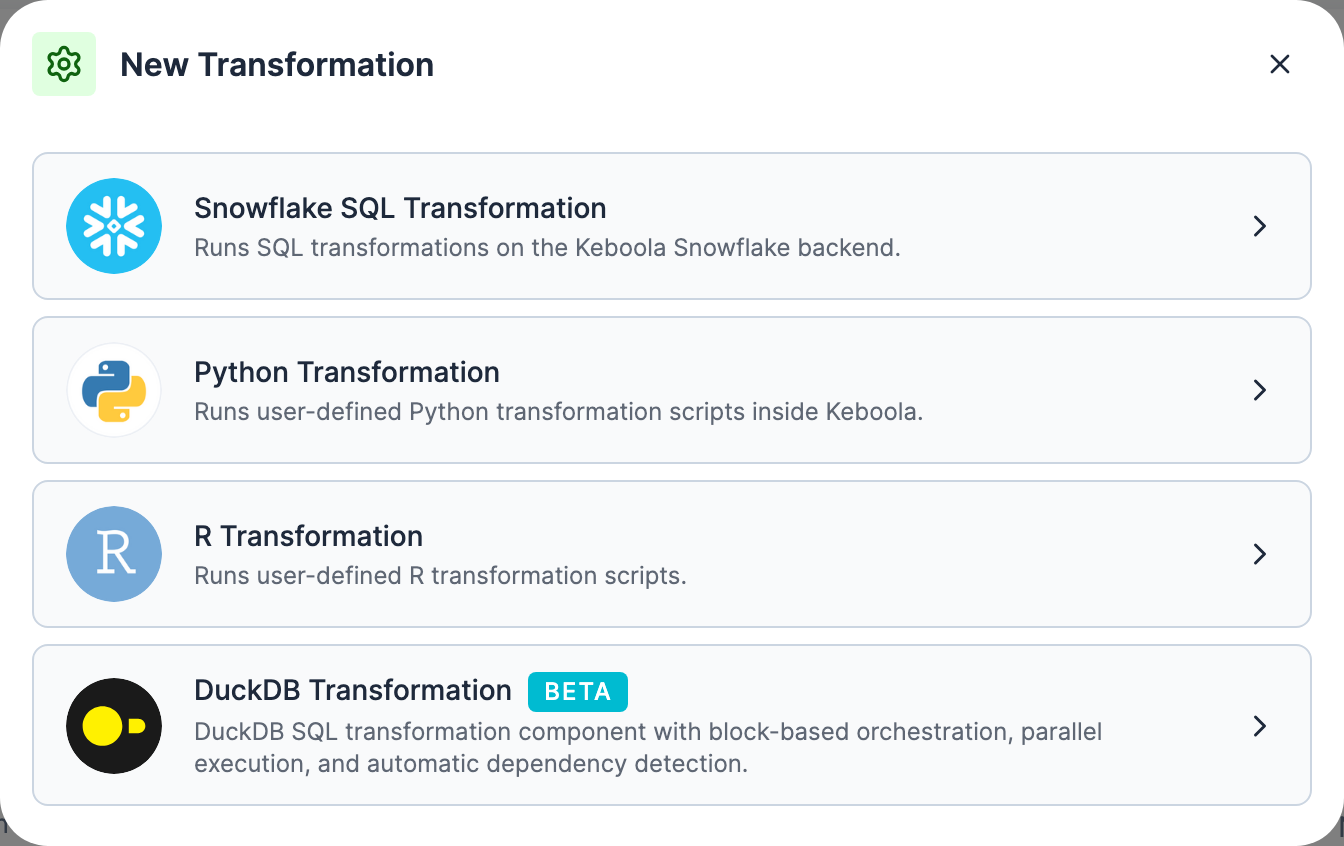
Click Create Transformation. The New Transformation dialog lists what this project can run, and it differs by project: an SQL entry for your backend, Snowflake SQL Transformation or Google BigQuery Transformation, plus Python, R, DuckDB (Beta), and on some projects dbt Core. Take the dialog as the authority on your project rather than this sentence.
Pick the SQL transformation your project offers, and use the matching query block below.
-
Name it
Boolabean staffing outlook, add a description, and in Folder typeBoolabeanand pick Create folder “Boolabean”. Folders are cosmetic, but they are the difference between a browsable project and a wall of configurations. If the dialog offers Use predefined code pattern, ignore it. Click Create transformation.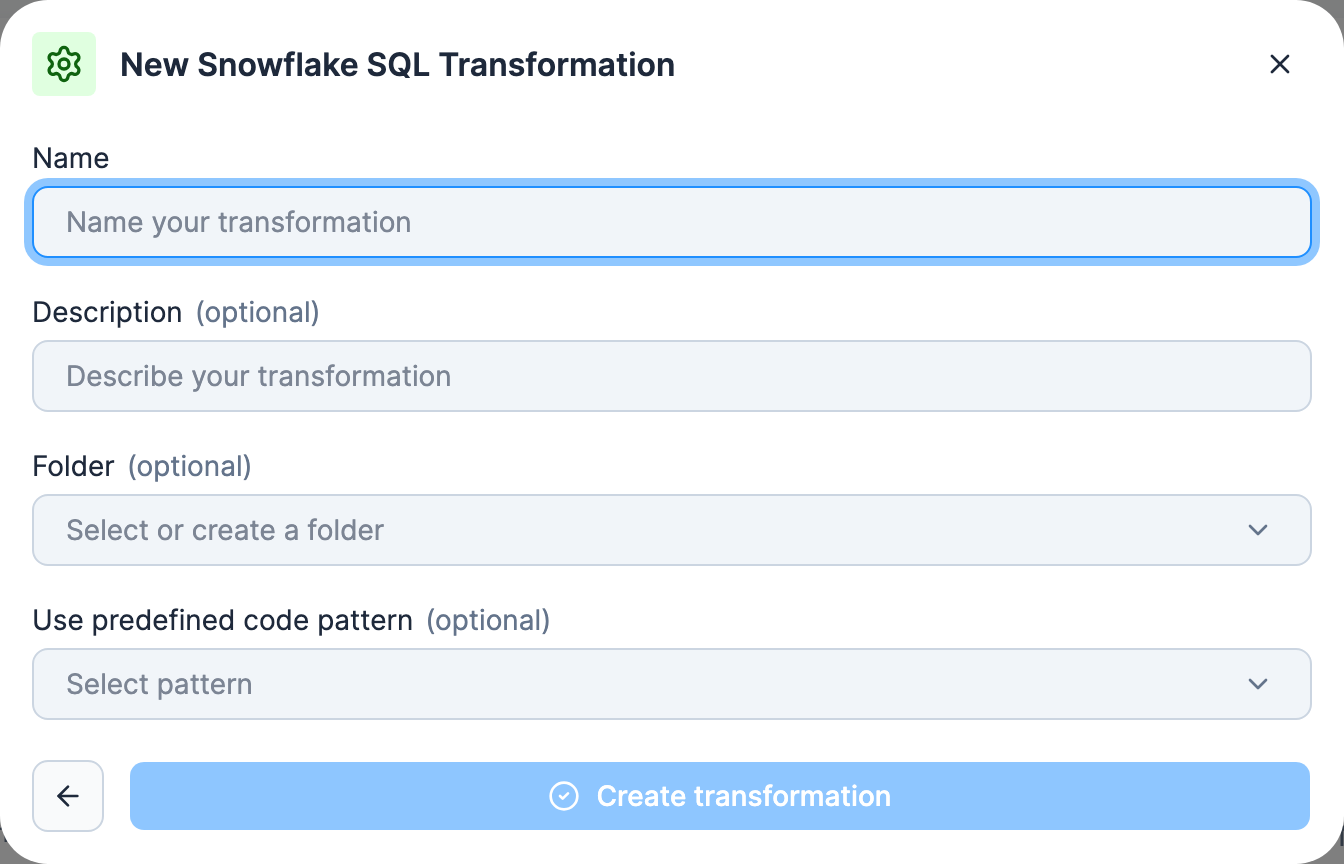
Set the input mapping
-
In Table Input Mapping, click Add Table Input.
-
Source searches your Storage as you type. Type
salesand tick the table; the picker is multi-select, so tickweather_daily,staffing,storesandforecasttoo. It keeps a count of what you have chosen, and it does not mind thatforecastsits in a different bucket.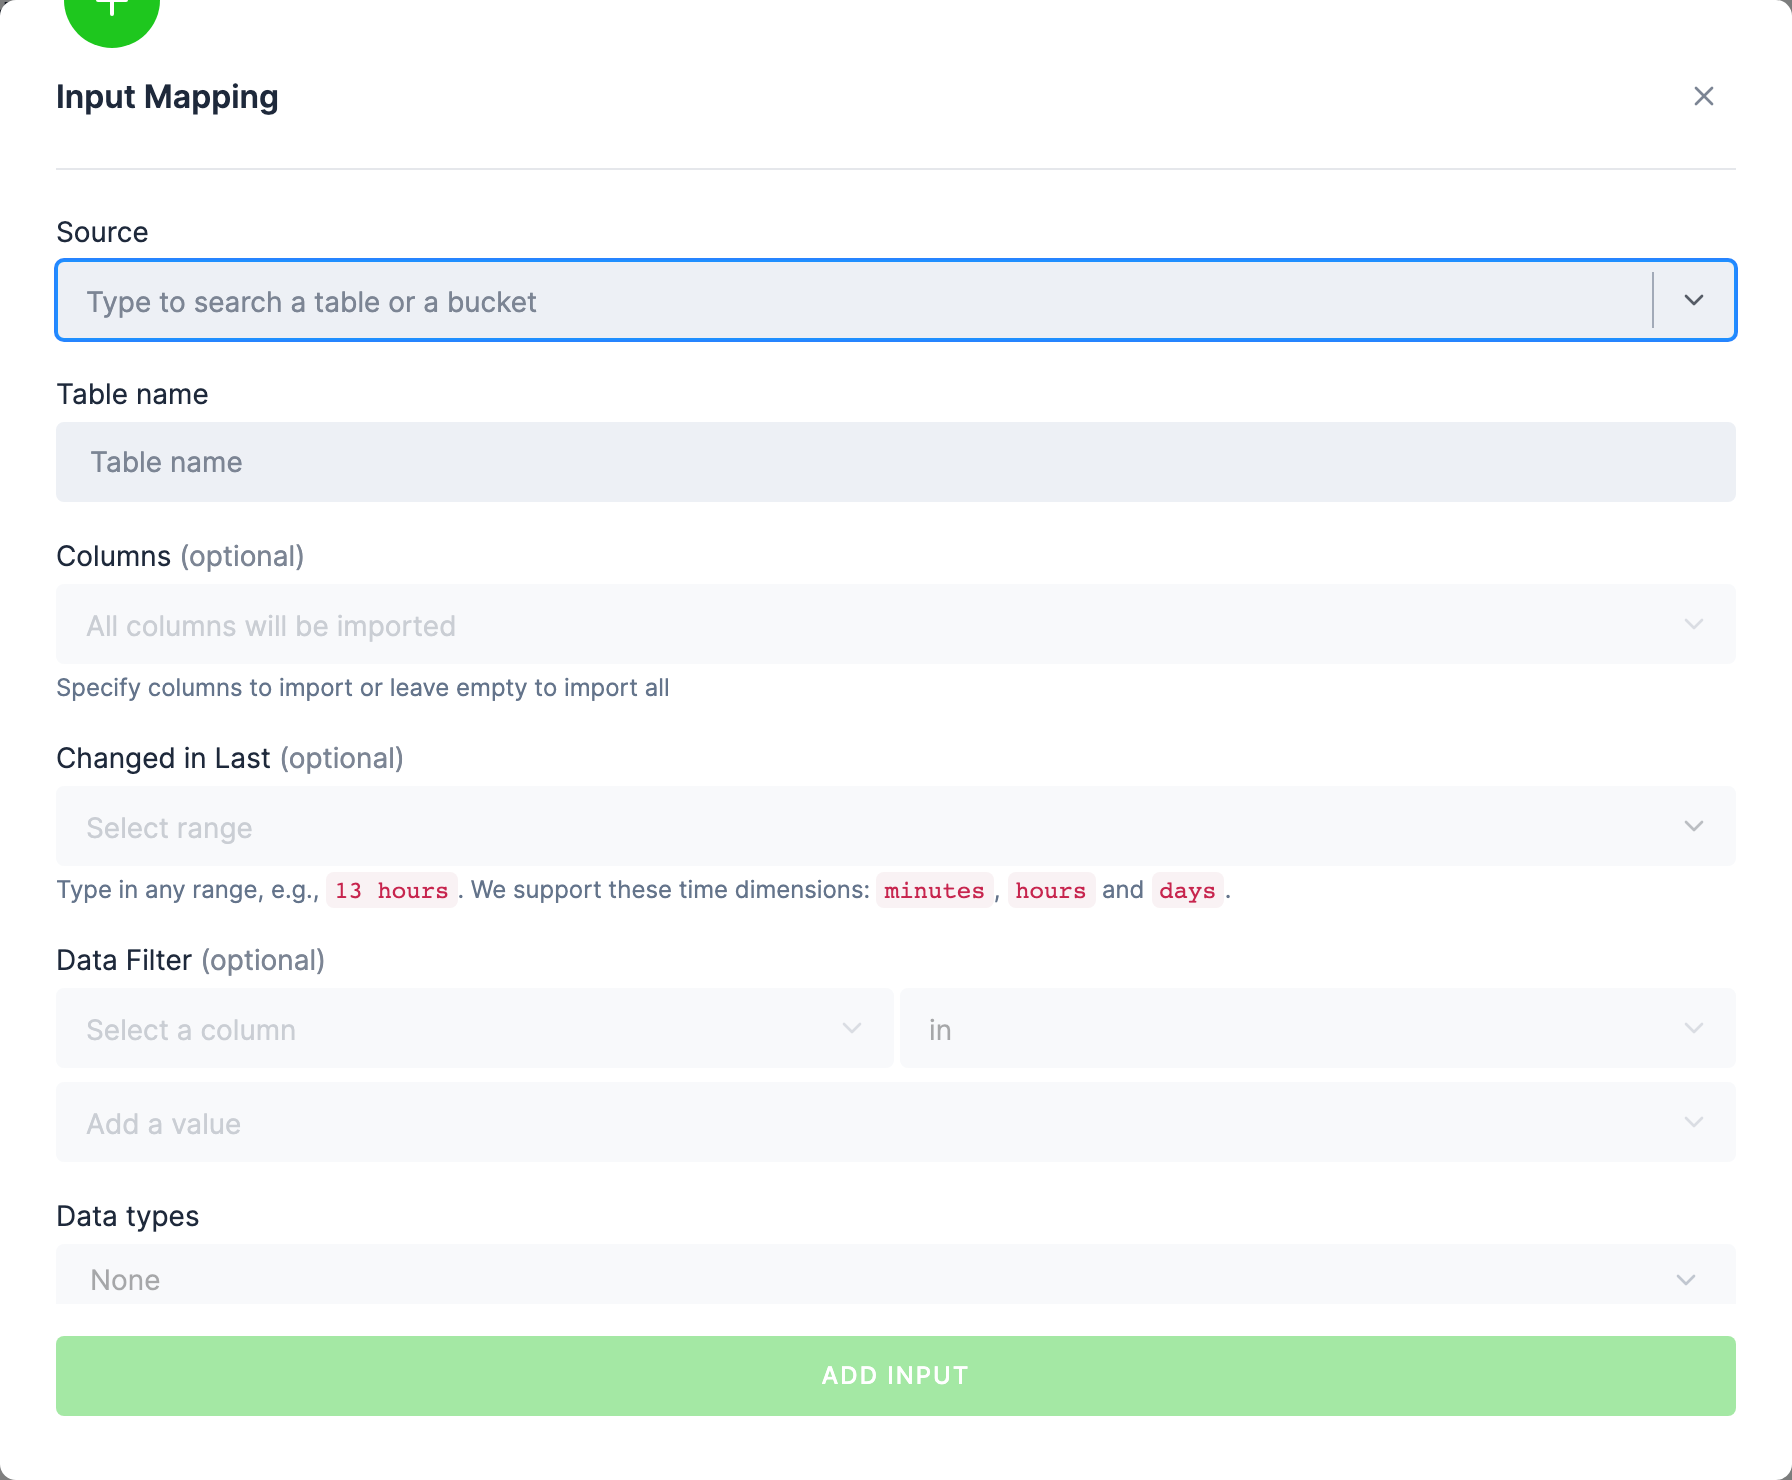
-
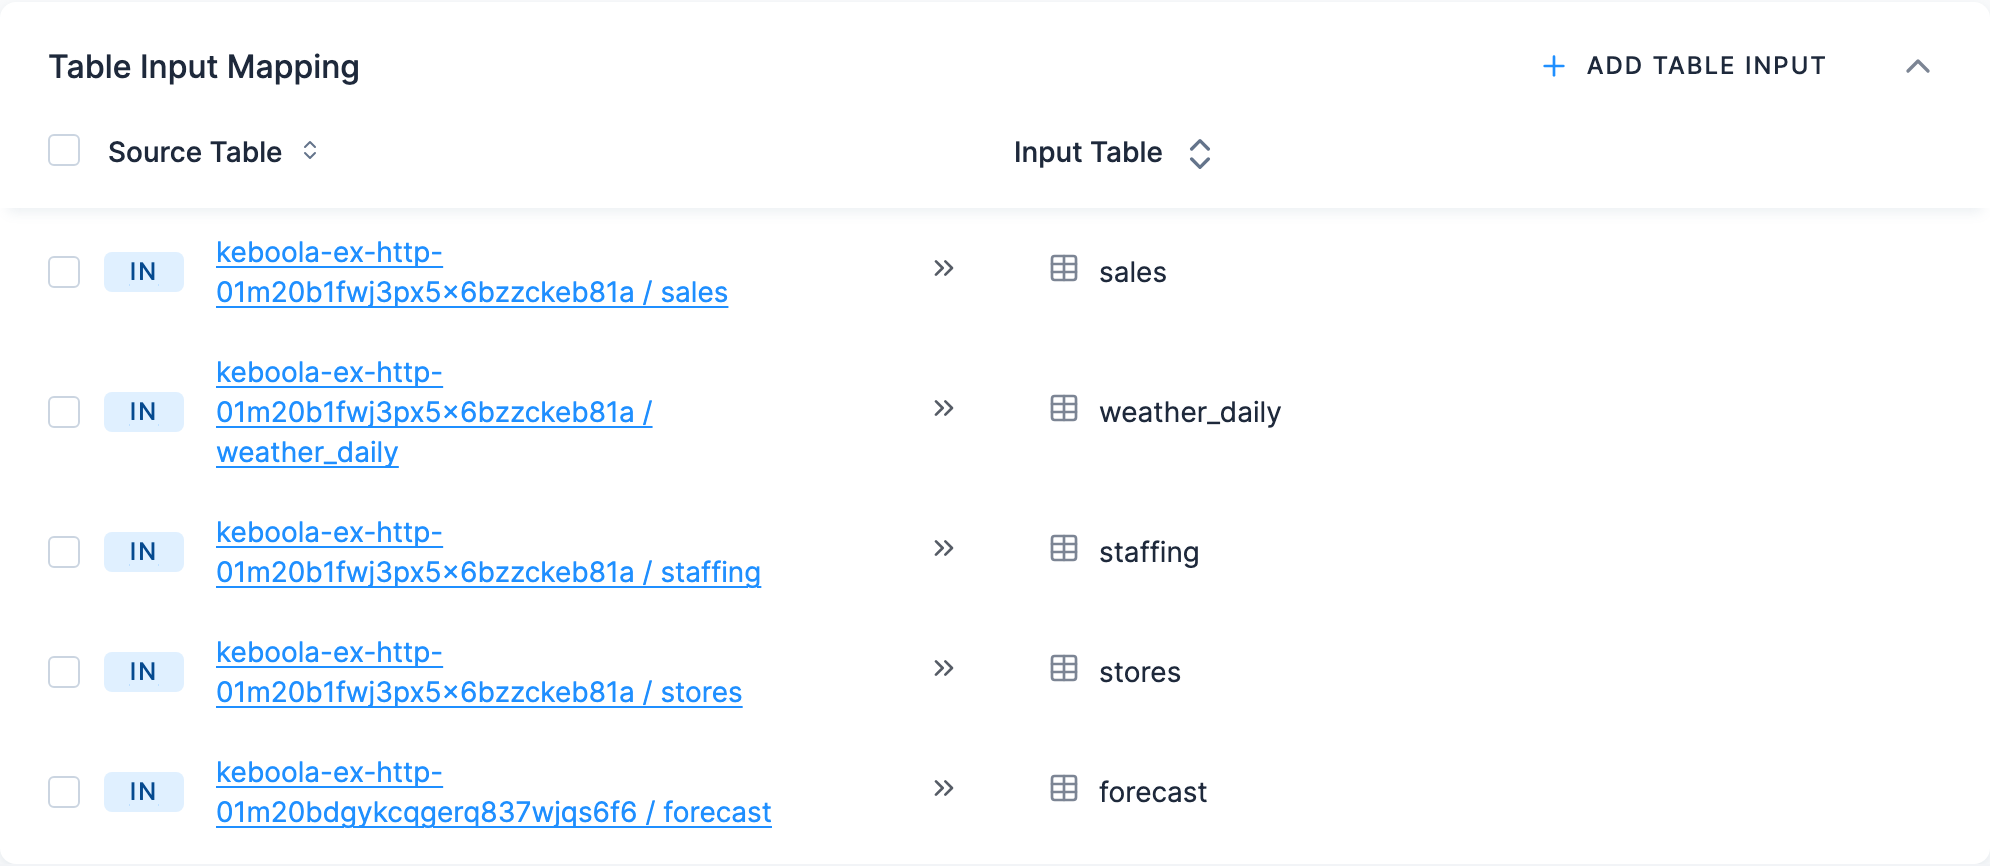
Click Add Input. Each table arrives with its Input Table name taken from the source table:
sales,weather_daily,staffing,stores,forecast.Those five names are what your SQL uses, which is why the queries below work no matter which buckets the tables actually live in. If you add a table on its own rather than in a batch, the dialog exposes the same value as a Table name field you can edit.
You should end up with five inputs, listed as Source Table → Input Table:
Input mapping has more to it: incremental processing with Changed in Last, column filters, data filters. None of it is needed here; see input mapping when you have a large table to process.
Set the output mapping
-
In Table Output Mapping, click New Table Output.
Output mapping opens in Guided Mode, the standard, copy-based mapping the steps below describe. If your project also shows Direct Mode, ignore it here: that writes straight to Storage and is a private beta.
-
Name the table
staffing_outlook. This is the name of a table your SQL will create; it does not exist yet. The field is labelled Table name, or Which table should we save? in Guided Mode. If the dialog warns you about case-sensitivity and suggests an UPPERCASE name, ignore the suggestion here and match your SQL exactly: the query blocks below createstaffing_outlookin lower case, and the name has to be the one the query actually creates. -
Destination is filled in for you from the transformation’s name:
out.c-Boolabean-staffing-outlook.staffing_outlook, that is theoutstage, a bucket named after the transformation, and the table. Neither the bucket nor the table exists yet; both are created the first time the transformation runs.
Write the queries
In the empty Queries section, click Create Multiple Queries. Your SQL lives in a code
inside a block: you get Block 1 holding one code. Paste the SQL for your project’s backend
and save.
You may get an editor for that one code, where you can also name it; call it Staffing outlook.
You may instead get a single All Queries editor holding every block and code at once, with the
structure marked by comment lines like /* ===== BLOCK: Block 1 ===== */; there, replace the
-- Your code goes here line and leave those markers alone, since they are what keeps the blocks
apart.
Later you can add another code to the same block with New Code, or a whole second block with New Code Block; that is how a longer transformation gets organized. Once there is code, the Queries header offers Copy Code and Edit Code.
If your project uses Snowflake
CREATE TABLE "staffing_outlook" ASWITH "daily_demand" AS ( SELECT "store_id", TRY_TO_DATE("date") AS "d", SUM(TRY_TO_NUMBER("units")) AS "daily_units" FROM "sales" GROUP BY "store_id", TRY_TO_DATE("date")),"demand_weather" AS ( SELECT dd."store_id", dd."daily_units", TRY_TO_DOUBLE(w."temp_max_c") AS "temp_max_c", TRY_TO_DOUBLE(w."rain_mm") AS "rain_mm" FROM "daily_demand" dd JOIN "weather_daily" w ON w."store_id" = dd."store_id" AND TRY_TO_DATE(w."date") = dd."d"),"band_avg" AS ( SELECT "store_id", CASE WHEN "temp_max_c" < 18 THEN 'cold' WHEN "temp_max_c" < 23 THEN 'mild' WHEN "temp_max_c" < 28 THEN 'warm' ELSE 'hot' END AS "temp_band", CASE WHEN "rain_mm" < 0.5 THEN 'dry' ELSE 'wet' END AS "rain_band", AVG("daily_units") AS "expected_units" FROM "demand_weather" WHERE "temp_max_c" IS NOT NULL AND "rain_mm" IS NOT NULL GROUP BY 1, 2, 3),"roster" AS ( SELECT "store_id", DAYNAME(TRY_TO_DATE("date")) AS "weekday", ROUND(AVG(TRY_TO_NUMBER("staff_on_shift"))) AS "rostered_staff" FROM "staffing" GROUP BY 1, 2),"forecast_days" AS ( SELECT 'S0' || (TRY_TO_NUMBER("location_id") + 1) AS "store_id", TRY_TO_DATE("time") AS "d", DAYNAME(TRY_TO_DATE("time")) AS "weekday", TRY_TO_DOUBLE("temperature_2m_max") AS "temp_max_c", TRY_TO_DOUBLE("precipitation_sum") AS "rain_mm" FROM "forecast")SELECT st."store_name", st."city", f."d" AS "date", f."weekday", f."temp_max_c" AS "forecast_temp_c", f."rain_mm" AS "forecast_rain_mm", ROUND(b."expected_units", 1) AS "expected_units", r."rostered_staff", ROUND(b."expected_units" / NULLIF(r."rostered_staff", 0), 1) AS "expected_units_per_person", CASE WHEN b."expected_units" / NULLIF(r."rostered_staff", 0) > 67 THEN TRUE ELSE FALSE END AS "short_handed"FROM "forecast_days" fJOIN "stores" st ON st."store_id" = f."store_id"LEFT JOIN "band_avg" b ON b."store_id" = f."store_id" AND b."temp_band" = CASE WHEN f."temp_max_c" < 18 THEN 'cold' WHEN f."temp_max_c" < 23 THEN 'mild' WHEN f."temp_max_c" < 28 THEN 'warm' ELSE 'hot' END AND b."rain_band" = CASE WHEN f."rain_mm" < 0.5 THEN 'dry' ELSE 'wet' ENDLEFT JOIN "roster" r ON r."store_id" = f."store_id" AND r."weekday" = f."weekday"ORDER BY f."d", st."store_name";One statement, five named steps. Every value it compares or averages is cast first: tables loaded
from CSV arrive as text, and TRY_TO_NUMBER, TRY_TO_DOUBLE and TRY_TO_DATE turn anything that
is not a number or a date into a clean NULL instead of an error. The WHERE in band_avg then
keeps such rows out of the averages.
Three join details carry the meaning. The forecast joins stores with a plain equality on the
café ID it derives from location_id. The averages and the roster come in through LEFT JOINs,
so a forecast day whose kind of weather never happened this summer keeps its row with an empty
expected_units rather than disappearing. And the two band CASEs, one on the history side and
one on the forecast side, have to be written identically, or days fall between the bands. None of
the joins can add rows: each band average and each roster value is one row per café, so the
output is bounded by the 42 forecast rows however the thresholds are written.
Every identifier is double-quoted because Snowflake upper-cases unquoted ones. Quoting the output aliases too is what gives the table lower-case column names; keep to one convention, because a table that already exists remembers the case of its columns (see the check below).
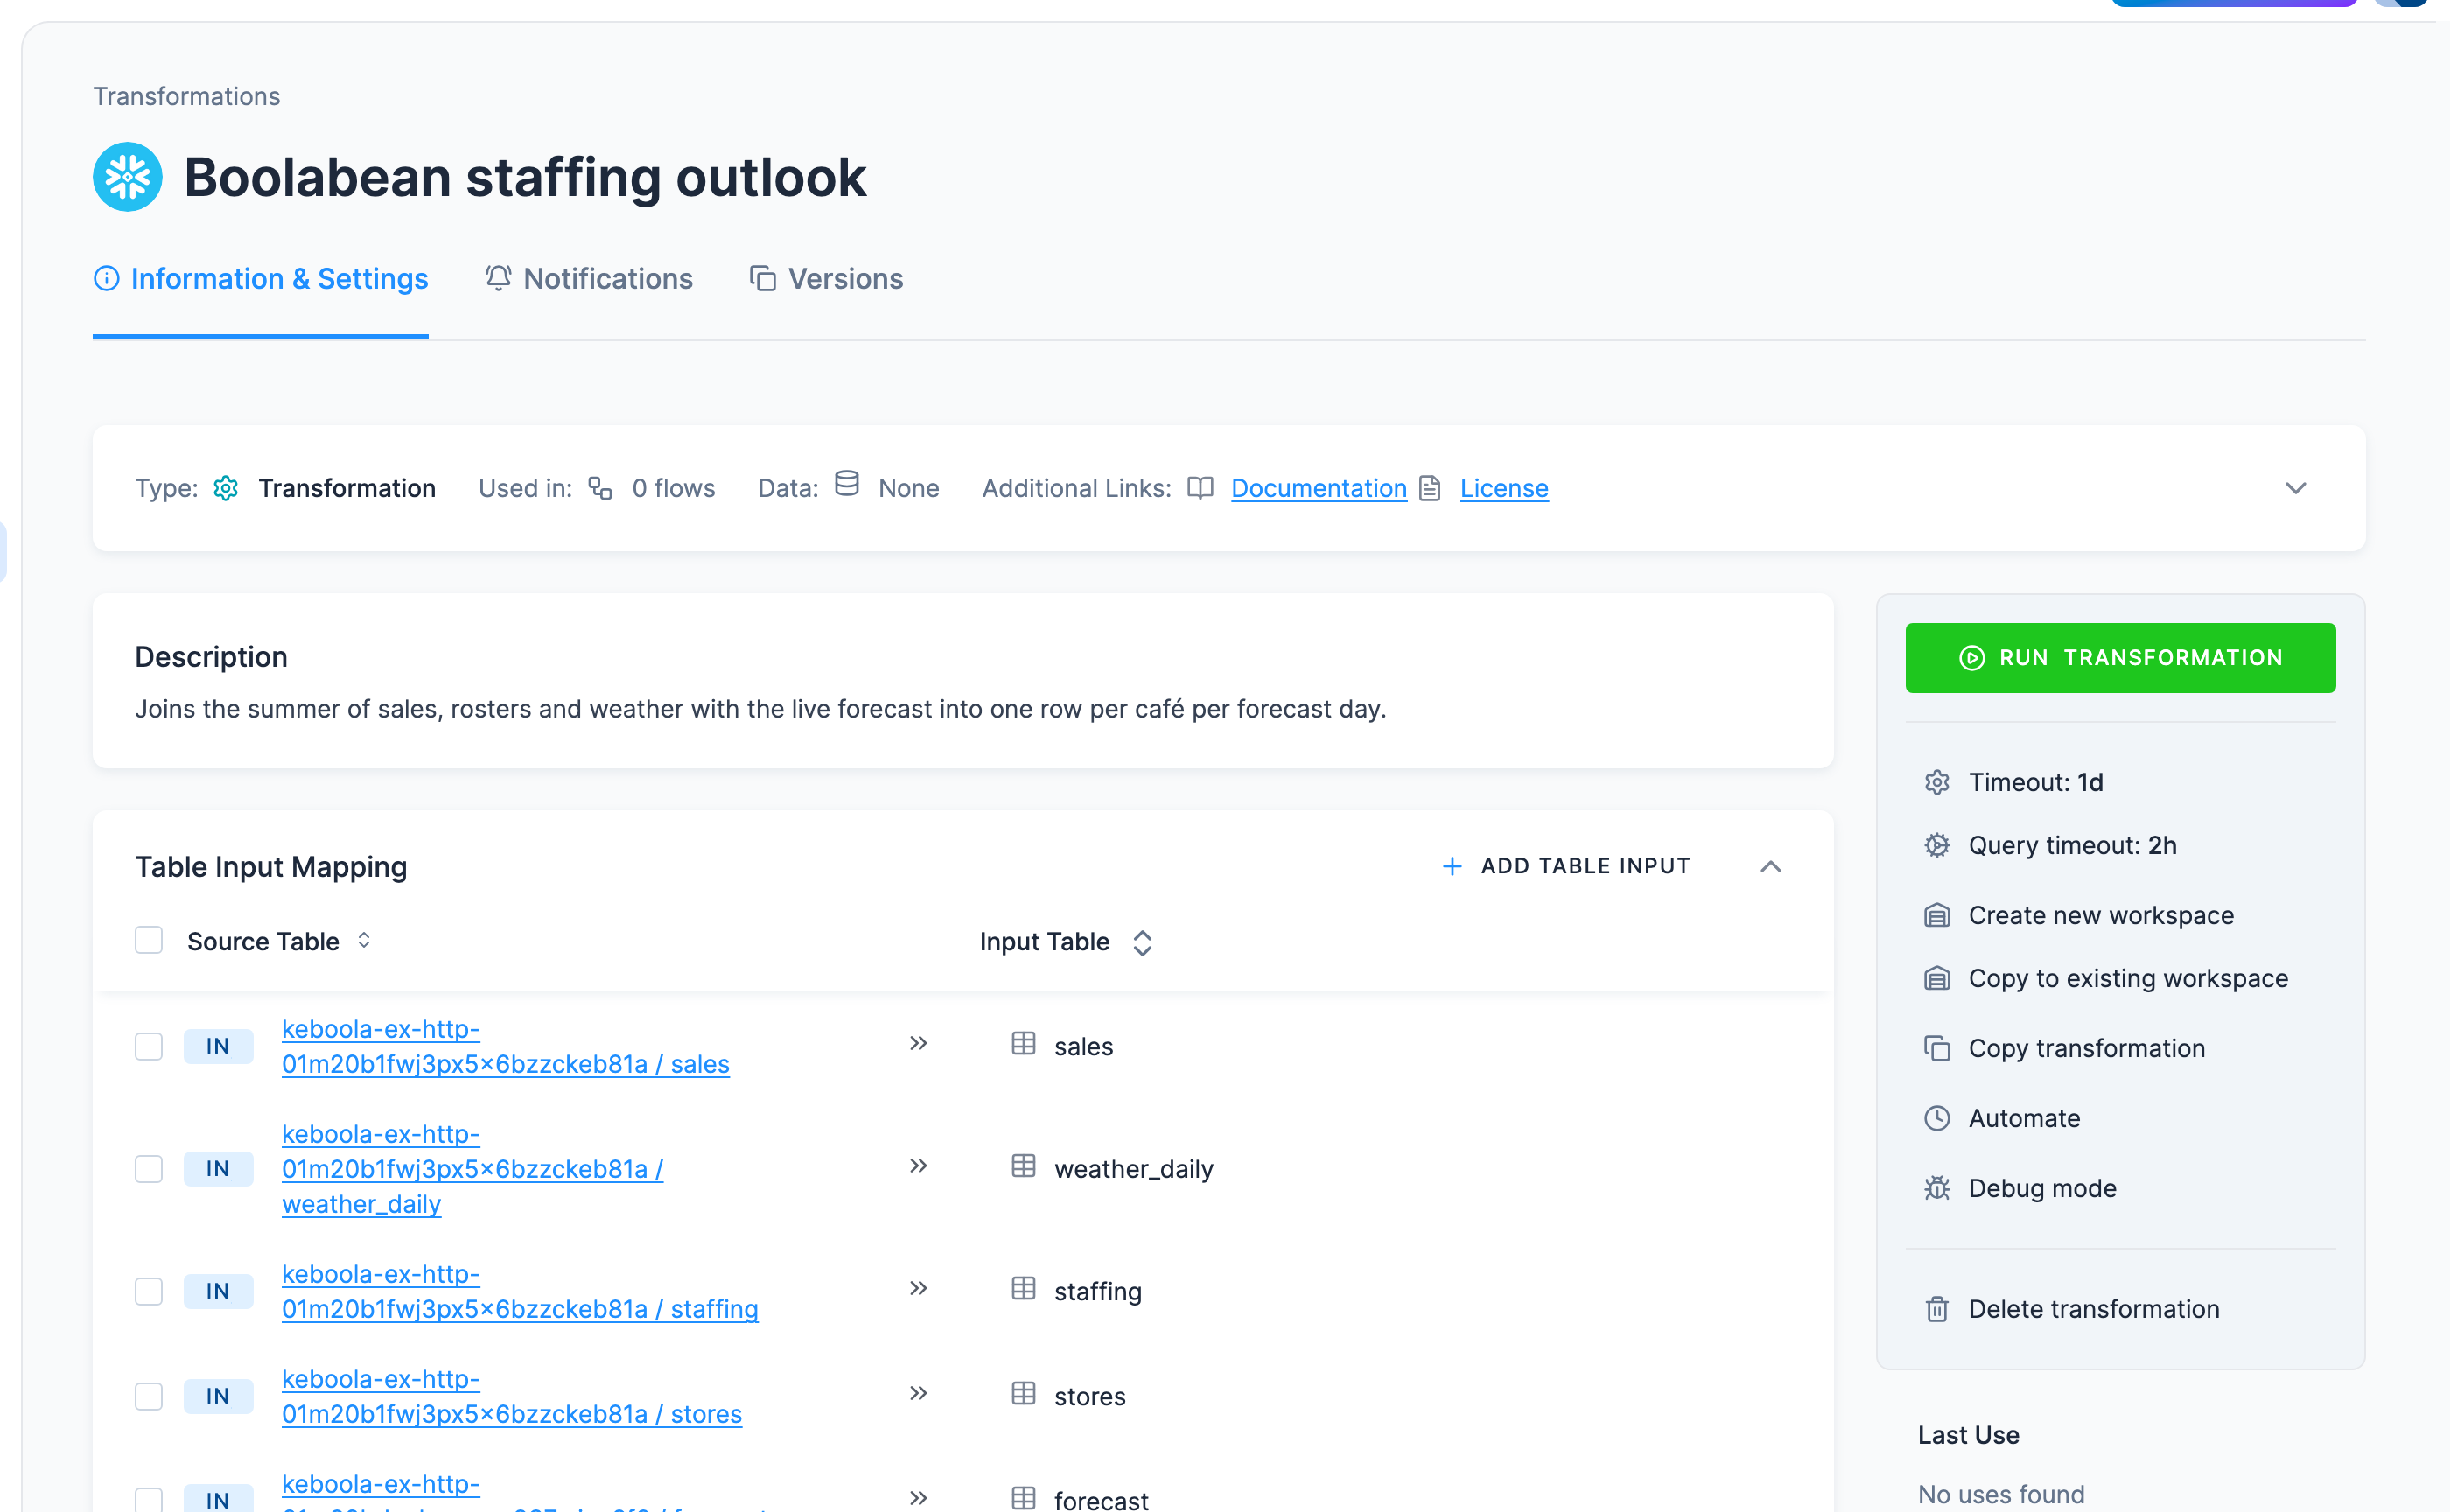
Back on the transformation’s own page, the Queries section now holds your code in Block 1:
If your project uses BigQuery
BigQuery does not quote identifiers this way. Backticks are
optional, and the block uses them on date and time only to keep those column names
unambiguous; SAFE_CAST stands in for the TRY_ functions. It is
written to produce the same table:
CREATE TABLE staffing_outlook ASWITH daily_demand AS ( SELECT store_id, SAFE_CAST(`date` AS DATE) AS d, SUM(SAFE_CAST(units AS INT64)) AS daily_units FROM sales GROUP BY store_id, d),demand_weather AS ( SELECT dd.store_id, dd.daily_units, SAFE_CAST(w.temp_max_c AS FLOAT64) AS temp_max_c, SAFE_CAST(w.rain_mm AS FLOAT64) AS rain_mm FROM daily_demand dd JOIN weather_daily w ON w.store_id = dd.store_id AND SAFE_CAST(w.`date` AS DATE) = dd.d),band_avg AS ( SELECT store_id, CASE WHEN temp_max_c < 18 THEN 'cold' WHEN temp_max_c < 23 THEN 'mild' WHEN temp_max_c < 28 THEN 'warm' ELSE 'hot' END AS temp_band, CASE WHEN rain_mm < 0.5 THEN 'dry' ELSE 'wet' END AS rain_band, AVG(daily_units) AS expected_units FROM demand_weather WHERE temp_max_c IS NOT NULL AND rain_mm IS NOT NULL GROUP BY 1, 2, 3),roster AS ( SELECT store_id, FORMAT_DATE('%a', SAFE_CAST(`date` AS DATE)) AS weekday, ROUND(AVG(SAFE_CAST(staff_on_shift AS INT64))) AS rostered_staff FROM staffing GROUP BY 1, 2),forecast_days AS ( SELECT CONCAT('S0', CAST(SAFE_CAST(location_id AS INT64) + 1 AS STRING)) AS store_id, SAFE_CAST(`time` AS DATE) AS d, FORMAT_DATE('%a', SAFE_CAST(`time` AS DATE)) AS weekday, SAFE_CAST(temperature_2m_max AS FLOAT64) AS temp_max_c, SAFE_CAST(precipitation_sum AS FLOAT64) AS rain_mm FROM forecast)SELECT st.store_name, st.city, f.d AS `date`, f.weekday, f.temp_max_c AS forecast_temp_c, f.rain_mm AS forecast_rain_mm, ROUND(b.expected_units, 1) AS expected_units, r.rostered_staff, ROUND(b.expected_units / NULLIF(r.rostered_staff, 0), 1) AS expected_units_per_person, COALESCE(b.expected_units / NULLIF(r.rostered_staff, 0) > 67, FALSE) AS short_handedFROM forecast_days fJOIN stores st ON st.store_id = f.store_idLEFT JOIN band_avg b ON b.store_id = f.store_id AND b.temp_band = CASE WHEN f.temp_max_c < 18 THEN 'cold' WHEN f.temp_max_c < 23 THEN 'mild' WHEN f.temp_max_c < 28 THEN 'warm' ELSE 'hot' END AND b.rain_band = CASE WHEN f.rain_mm < 0.5 THEN 'dry' ELSE 'wet' ENDLEFT JOIN roster r ON r.store_id = f.store_id AND r.weekday = f.weekdayORDER BY f.d, st.store_name;kbagent builds the same transformation from a SQL file. Connect it to your project once with
kbagent project add (see the CLI quickstart); the examples use
docs-demo as the project alias.
Create it from the SQL
The SQL is the same either way: copy the block for your backend from the UI tab above, the
Snowflake one or the BigQuery one, into a file called staffing_outlook.sql. Then:
kbagent transformation create --project docs-demo --name "Boolabean staffing outlook" --sql-file staffing_outlook.sql --created-table staffing_outlookWithout --component-id this uses the project’s own SQL backend, which is what you want. Name it
explicitly (keboola.snowflake-transformation or keboola.google-bigquery-transformation) only if
you have a reason to.
--created-table is the output mapping: it maps the table the SQL creates to
out.c-<name-derived-bucket>.staffing_outlook. Add --dry-run to see the configuration it would
write before it writes it.
It prints the new configuration ID; the next two commands need it. kbagent config list --project docs-demo --component-id keboola.snowflake-transformation finds it again later.
Add the input mapping
transformation create leaves the input mapping empty, and the SQL above reads its tables by the
short names the mapping gives them, so the next command fills it in. --storage replaces
configuration.storage wholesale, which means the file has to carry the output mapping too:
kbagent transformation edit --project docs-demo --config-id <config-id> --change-description "Add the five input tables" --storage @storage.json{ "input": { "tables": [ { "source": "in.c-keboola-ex-http-<sales-config-id>.sales", "destination": "sales" }, { "source": "in.c-keboola-ex-http-<sales-config-id>.weather_daily", "destination": "weather_daily" }, { "source": "in.c-keboola-ex-http-<sales-config-id>.staffing", "destination": "staffing" }, { "source": "in.c-keboola-ex-http-<sales-config-id>.stores", "destination": "stores" }, { "source": "in.c-keboola-ex-http-<forecast-config-id>.forecast", "destination": "forecast" } ]}, "output": { "tables": [ { "source": "staffing_outlook", "destination": "out.c-Boolabean-staffing-outlook.staffing_outlook" } ]}}kbagent storage buckets --project docs-demo lists the bucket names if you do not have the two
configuration IDs to hand.
Run it and read the result
kbagent job run --project docs-demo --component-id keboola.snowflake-transformation --config-id <config-id> --waitOn a BigQuery project the component ID is keboola.google-bigquery-transformation.
kbagent storage table-detail --project docs-demo --table-id out.c-Boolabean-staffing-outlook.staffing_outlookCheck: the table detail reports 42 rows and the ten columns. kbagent transformation show --project docs-demo --config-id <config-id> prints the block and code tree if you want to see what
was written.
Run it and check the result
Section titled “Run it and check the result”Coming from the Prompt or CLI / API tab? The run already happened: the prompt asked for
it, and job run --wait did it. Skip to the row-count check below.
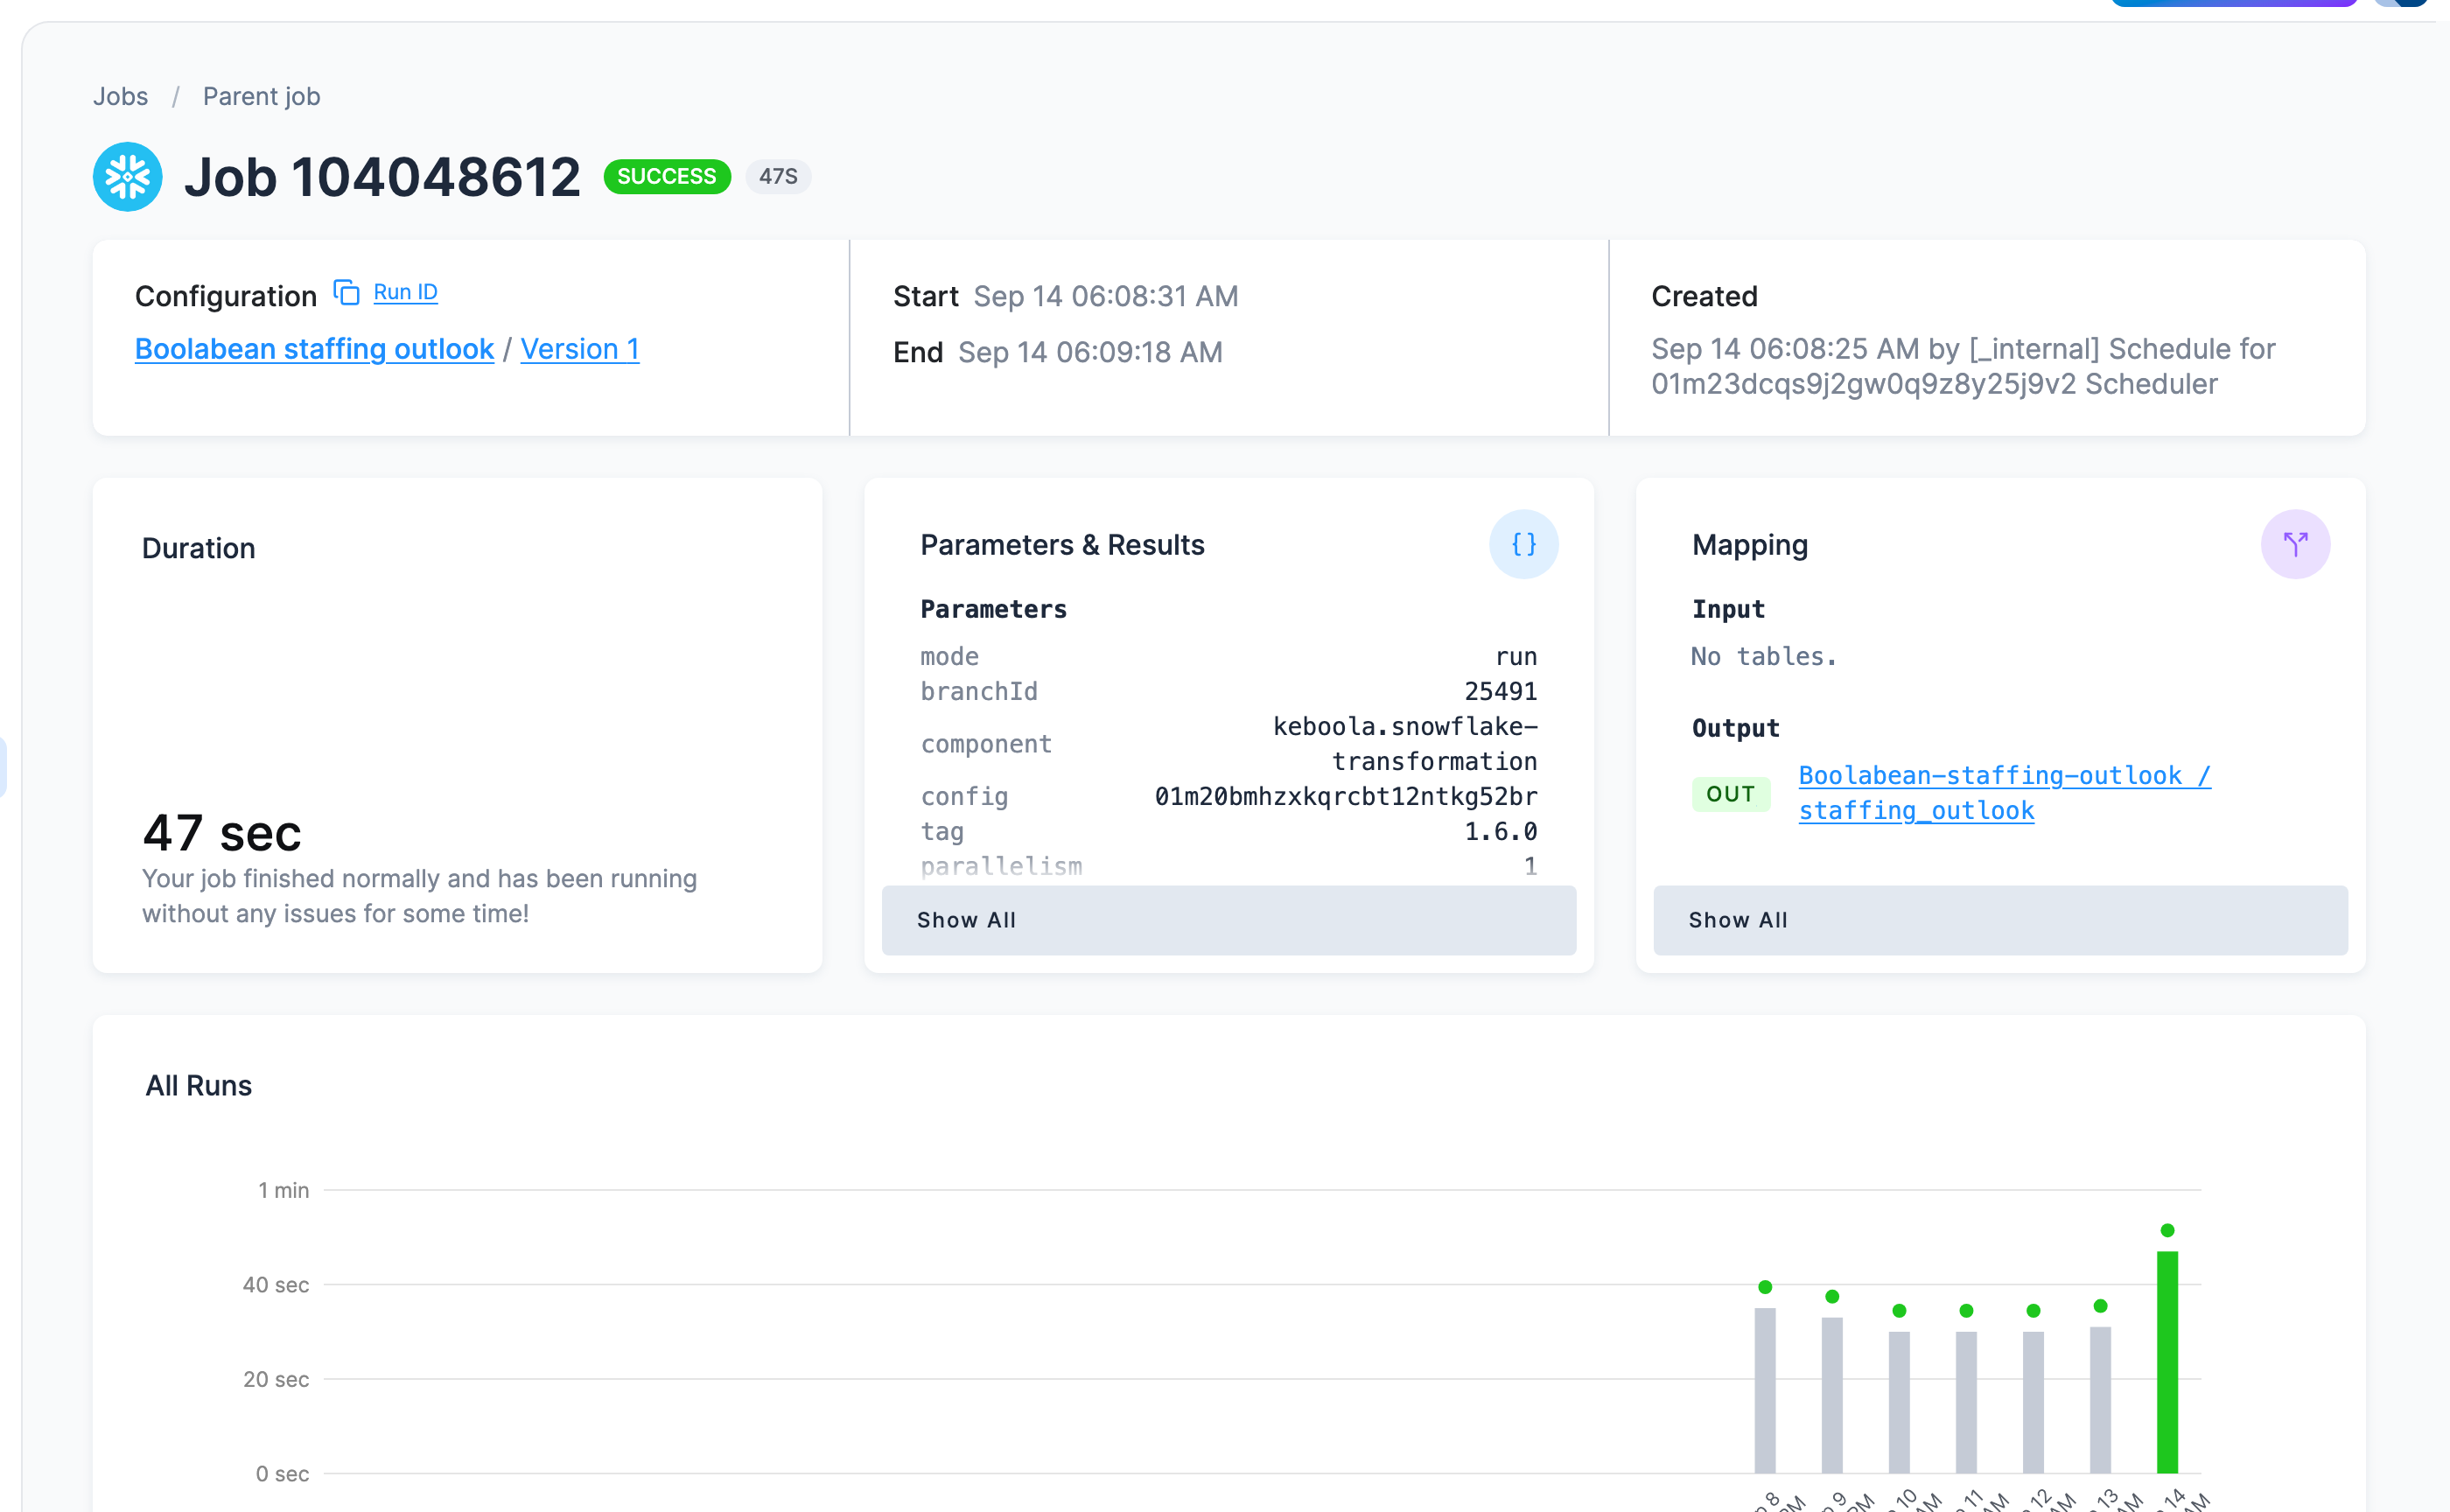
Click Run Transformation and confirm with Run. That creates a background job which copies
the input tables in, runs your SQL, and writes staffing_outlook back to Storage: the mapping
model from the top of this page, in action.
A notification appears with a Show job link (Snowflake SQL job has been scheduled, or your backend’s equivalent) and you can also find it under Jobs. It takes about a minute, and a green Success means it worked.
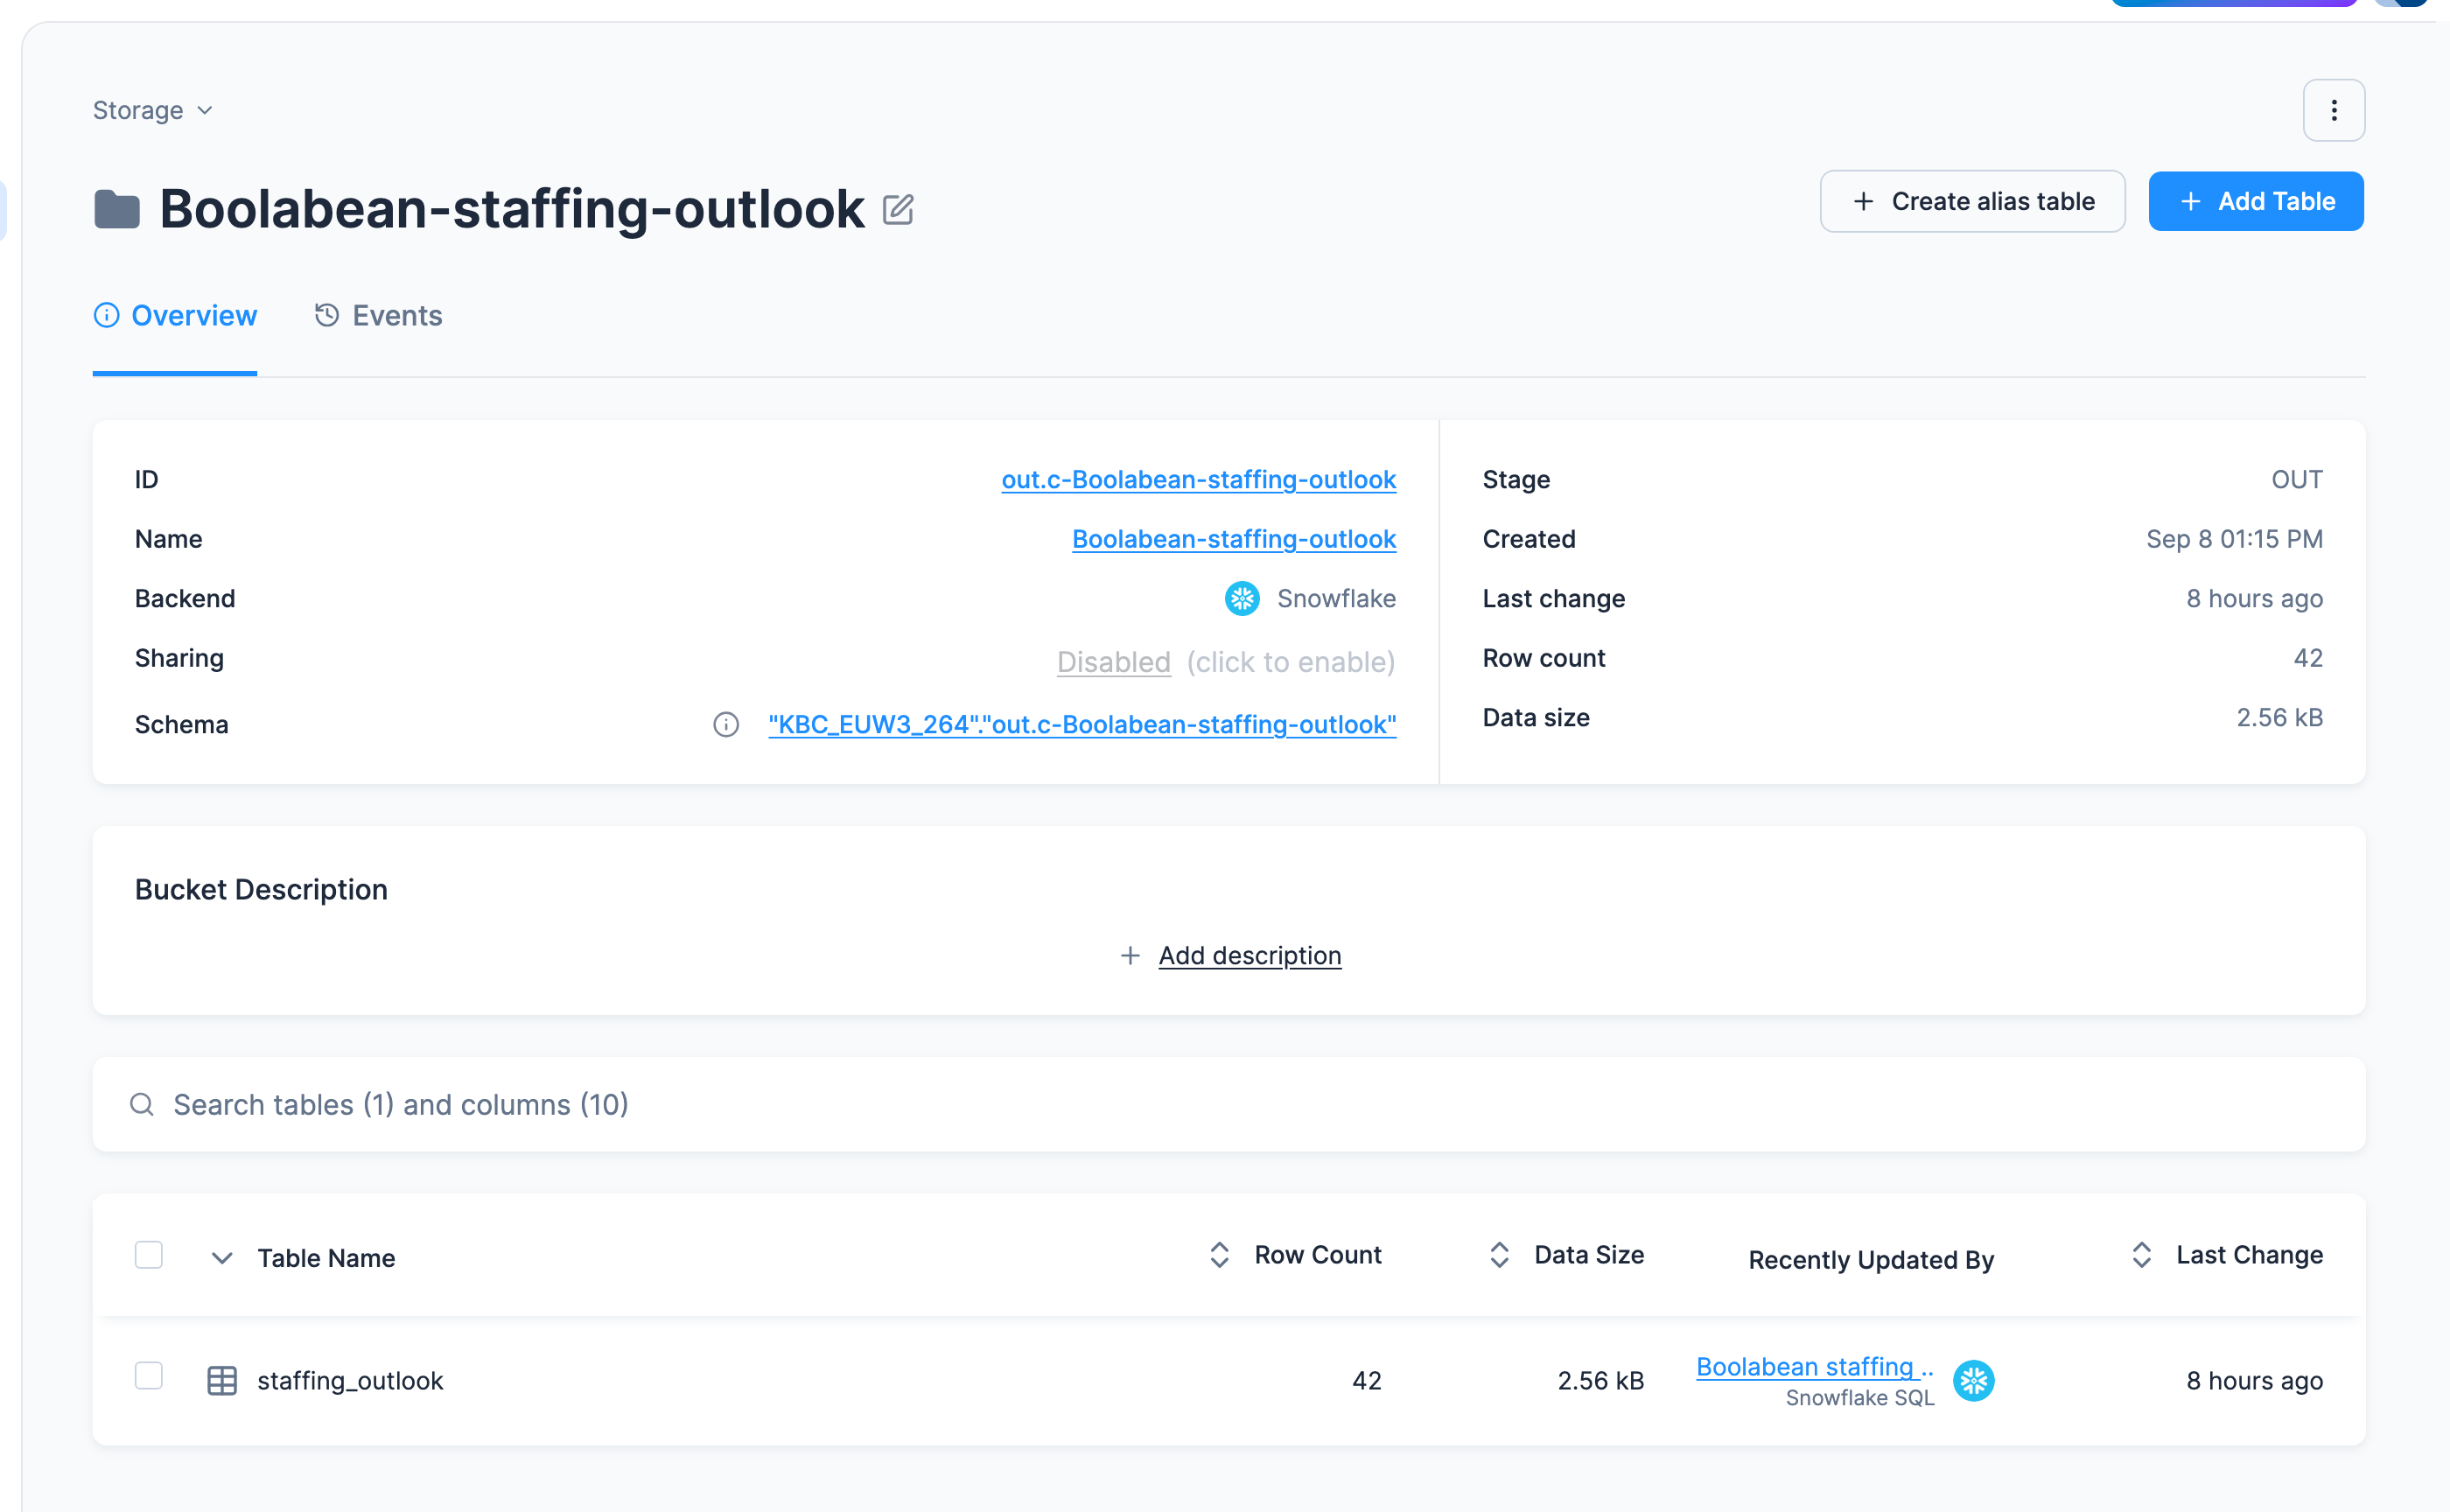
Then open Storage: there is a new bucket out.c-Boolabean-staffing-outlook, listed as
Boolabean-staffing-outlook with an OUT badge the same way the in.c- prefix was hidden
before, holding staffing_outlook with 42 rows and 10 columns.
Three checks, in order of how much they tell you:
- 42 rows, which is six cafés times seven forecast days. More than 42 means an input table
has duplicate rows (a forecast loaded twice with incremental load on, a café listed twice);
fewer means a join dropped a café or a day, most often because
location_iddid not map onto astore_id. - No two rows share a café and a date. Open the Data Sample tab and sort by
store_name; each café should show seven different dates. short_handedis true on a few rows, not on all and not on none. Sort byexpected_units_per_persondescending: the top row is the café and day the whole guide is about, and the next page asks Kai to explain it. How many rows are flagged depends on the forecast; our week had four, and a cool, wet week can flag nothing, which is the table being right.
The 10 columns are store_name, city, date, weekday, forecast_temp_c,
forecast_rain_mm, expected_units, rostered_staff, expected_units_per_person and
short_handed. If Kai built the table, Storage may show them in upper case: Snowflake upper-cases
an alias that is not quoted, and the names are the same names. An empty expected_units on a row is not an error: it means the summer never had
a day in that café’s band, so there is no history to average. In this sample that band is cold
and dry: five of the six cafés had no dry day under 18 °C all summer.
The table list also has a Recently Updated By column, naming the transformation and its
backend (Boolabean staffing outlook / Snowflake SQL here), the fastest way to answer “where did
this table come from?” months later.
In Storage, the table list shows it:
Running the transformation again rebuilds the table; it is safe to re-run while you are experimenting. Tomorrow’s forecast gives you tomorrow’s table, which is what the scheduling page is for.
If it goes wrong
Section titled “If it goes wrong”Object 'SALES' does not exist(Snowflake). A table is missing from the input mapping, or the Table name inside the transformation differs from what the SQL uses. Snowflake upper-cases unquoted identifiers, which is why every identifier is double-quoted. On BigQuery the equivalent error isTable ... was not found.- The job succeeds but Storage has no new table. The output mapping is empty or names a table
your SQL never creates. The names must match exactly:
staffing_outlook. Failed to process output mapping … Some columns are missing in the csv file. Missing columns: STORE_NAME, CITY, …The table already exists in Storage, with column names in a different case from the ones your query produced this time. An existing table remembers the exact names of its columns, and Snowflake upper-cases an alias you did not quote, so switching between quoted and unquoted aliases between runs is enough to trigger it. Either keep the alias style that created the table, or delete the table in Storage and run again. It happens when the Prompt tab created the table first and the hand-written query writes into it, and the other way round.Numeric value '' is not recognized. Tables loaded from CSV arrive as text columns unless you give them types, so an empty cell is''rather thanNULL. The queries cast withTRY_TO_(Snowflake) orSAFE_CAST(BigQuery) before comparing; if you see this error, a cast got dropped somewhere.- The table has more than 42 rows. An input has duplicates. The forecast configuration ran
with Incremental load on and appended a second copy, or
storeslists a café twice. The joins cannot do this on their own; look at the inputs, and switch incremental load off on the forecast row. - Every row has an empty
expected_units. The bandCASEon the forecast side does not produce the same labels as the one on the history side, so nothing joins. Compare the two expressions character by character. Invalid columns: _timestampwhen the output is written. Your input tables were staged by cloning, which copies Keboola’s internal_timestampcolumn along with the data, and that column cannot be written back to Storage. It is not backend-specific and it is not a problem with the query. The clean fix is thedropTimestampColumnoption on the input mapping; see the_timestampsystem column.- You want to see what the query actually returns before saving. That is what a workspace is for.
- You would rather not read the log yourself. Kai has it open already
(Troubleshooting):
My transformation "Boolabean staffing outlook" failed. Read the last job's log and tell me what to fix.
Going further
Section titled “Going further”- Use a workspace to develop and test queries against a copy of the data before committing them to a transformation. This is how the work is really done.